- Am I estimating as many jobs this year as last year?
- Am I closing as many jobs as last year?
- Am I bidding more expensive jobs this year than last?
- What kind of jobs should I be bidding?
As a business owner, you should be asking yourself these questions; the answers will give you a snapshot of your sales status. Without statistics, you would have to guess at the answers to these questions. But with PEP Cloud, you don’t need to guess.
The Dashboard is part of your PEP Cloud home page. It shows you statistical information about your sales. Today we’re going to focus on the benefits of looking at Year-To-Date stats.
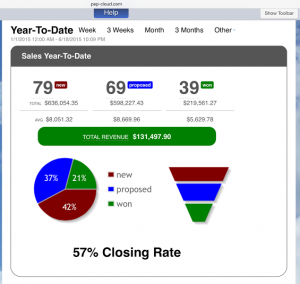
What am I looking at here?
Since January 1, 2015, this business owner has made 79 estimates; the average estimate is about $8050. Of those 79 estimates, 69 of them were turned into proposals for customers; the proposal average is about $8700. Of the 69 proposals, 39 of them were accepted – that’s a closing rate of 57%. The average accepted job value is $5600. Actual revenue collected to date is in the green box.
What’s the pie chart?
The pie chart is a visual representation of the numbers above. Ideally, you want to make a proposal for every estimate you create, and you want every proposal to be accepted. If that were the case, each wedge would be the same size.
Got it. Now what?
To the right of “ Year-to-Date”, click “Other” and select “PYTD” to see statistics for the same time period last year.
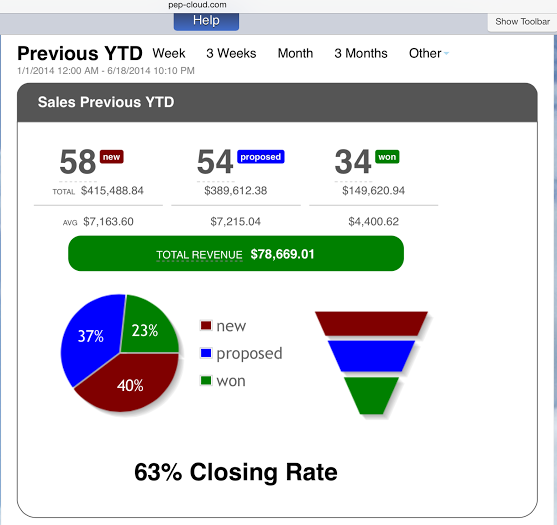
From January 1-June 18, 2014, this same business owner made 58 estimates, 54 proposals, and had 34 jobs accepted.
Analysis for this business owner:
- Am I estimating as many jobs this year as last year? 75% more estimates this year!
- Am I closing as many jobs as last year? Numbers-wise, you’ve closed 5 more jobs, but your closing rate had actually dropped since last year.
- Am I bidding more expensive jobs this year than last? Yes! Your bids average almost $900 more; proposals average $1485 more; and accepted jobs average $1230 more.
This business owner has been busy this year making more estimates, more proposals, and closing more jobs, even though the closing rate was higher last year. The average job value is higher this year. Dollar-wise, the company almost $52,800 ahead of where it was last year.
Bottom line: What kind of jobs should I be bidding? For this business, the statistics show that it should continue to focus its energy on making higher value estimates and proposals.
Recent Comments