How can graphs help you?
If you’re curious about how your business is doing, building graphs is a great way to see the information that matters. Graphs let you keep a close eye on trends so that you can make informed decisions about your business.
Visual Reports
The human brain processes images faster than text. So graphs make it easier to see what’s happening in your business.
Easy to Build
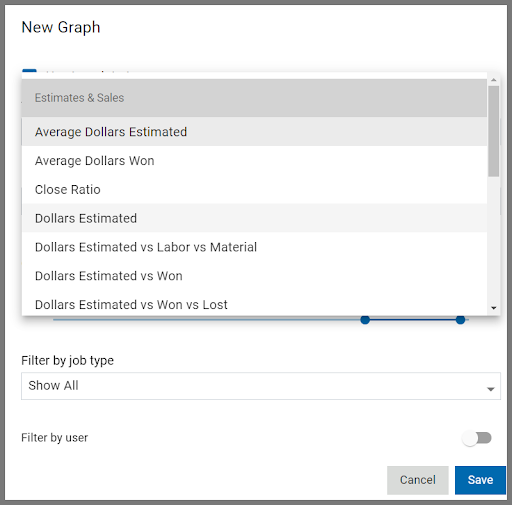
Use templates to graph information in several areas.
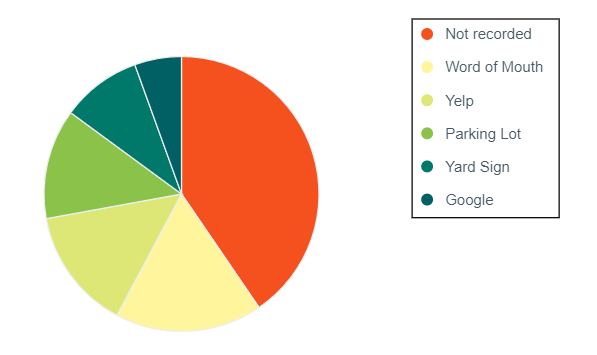
- Lead Source – See where your business is coming from.
- Estimates and Sales – Follow the number of estimates, jobs won, and workflow.
And coming soon…
-
- Financials – Track your sales/income, expenses, etc. You will need to use job logs to record income in order to graph profitability (more on that to come).
Easy to Maintain

Graphs in PEP display data based on the work you’re already doing. All graphs automatically refresh on the first day of each month but you can refresh an individual graph at any time.
Recent Comments